
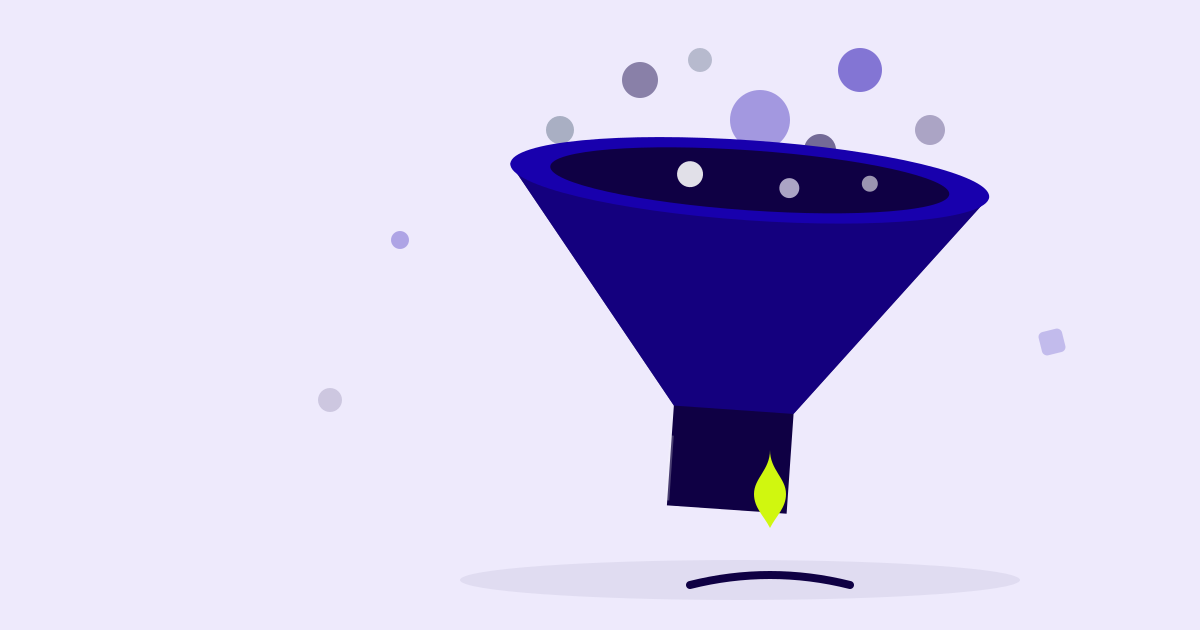
Sales funnel statistics keep exposing the same pattern. Most B2B teams don't have a lead volume problem, they have a conversion problem hiding at one or two specific stages. The median B2B website converts at just 2.9% overall, while top-quartile SaaS teams hit 39% at the lead-to-MQL stage alone. This piece breaks down where funnels actually leak, using current B2B funnel conversion benchmarks by stage, industry, and deal size.
Sales Funnel Statistics by Stage
Sales funnel statistics only mean something once you break them apart by stage, since a healthy top-of-funnel number can hide a broken stage further down. A marketing qualified lead (MQL) is a prospect marketing has flagged as ready for sales attention. A sales qualified lead (SQL) is one sales vetted and accepted into the pipeline.
Running these ranges against real traffic shows how much stage-by-stage improvement compounds. Starting from 10,000 visitors, an average funnel produces roughly 4 to 5 paying customers end to end. Lifting just the MQL-to-SQL stage from 37% to 45% turns that same traffic into 6 to 7 customers instead, without adding a single new visitor.
B2B and SaaS Funnel Benchmarks
B2B funnel conversion benchmarks vary sharply between broad B2B averages and SaaS-specific performance, mostly because SaaS buyers self-select earlier in the journey.
- The median B2B website conversion rate sits at 2.9%, compared to a 6.6% cross-industry average that includes ecommerce and B2C.
- B2B SaaS companies specifically convert at around 3.8%, still below the broader cross-industry median.
- SaaS visitor-to-lead conversion averages 1.5% to 2.5%, with top companies converting nearly 10x more visitors than average performers.
- Top-quartile SaaS teams hit 39% lead-to-MQL and 38% MQL-to-SQL conversion, both well above general B2B benchmarks.
- Overall B2B win rates run 17% to 20%, with the average sales cycle spanning 60 to 120 days.
- Enterprise deals convert at lower percentages than SMB deals, but typically carry far higher contract values per closed deal.
- Across B2B and membership-driven models, overall funnel conversion commonly falls between 3% and 5%.
Building a funnel around these benchmarks works best alongside a B2B SEO strategy, since organic traffic quality shapes every conversion rate below it.
Where Funnels Actually Leak
Sales funnel statistics on drop-off point to the same conclusion. Most funnel problems live in one specific transition rather than spreading across the whole journey.
- 68% of businesses have no fully defined, documented, or measured sales funnel strategy in place. A fractional SEO or growth partner often gets brought in specifically to build that missing structure.
- Global cart abandonment sits at roughly 75.6% across ecommerce and B2B checkout flows.
- Average form abandonment runs close to 81%, often driven by excessive form fields or unclear next steps.
- Visitor-to-lead rates below 1% usually point to a page quality or offer relevance problem, separate from traffic volume.
- Reducing form fields on a lead funnel produced a 53.8% increase in average sales revenue per visitor in one documented case.
- Simplifying page copy from college-level to a 5th to 7th grade reading level lifted conversion rates from 5.3% to 11.1%, a 56% improvement.
Funnel Optimization ROI
Fixing an existing funnel consistently outperforms spending more to drive additional traffic into it. This work is usually called conversion rate optimization (CRO), and the numbers behind it are hard to ignore.
- Structured conversion rate optimization programs deliver an average 223% ROI, or roughly $3 in revenue for every $1 invested.
- Companies spend $92 on customer acquisition for every $1 spent on converting that traffic, a heavily lopsided ratio given CRO's proven return.
- Companies using CRO tools on landing pages see an average 30% lift in conversion rates.
- Businesses that excel at lead nurturing generate 50% more sales-ready leads at 33% lower cost than those that don't.
- Lead nurturing emails achieve an 8% click-through rate, compared to 3% for general marketing sends.
- Only 39.6% of companies report having a fully documented, structured CRO plan in place.
- Organizations with a dedicated funnel optimization function report 38.4% higher marketing ROI than those without one.
A SaaS content marketing program built around these benchmarks tends to close far more of the gap than a generic content calendar would.
AI and Personalization in Funnel Optimization
AI adoption inside funnel optimization has moved from experimental to mainstream in about two years.
- AI-powered personalization tool adoption reached 79% in 2026, up from 68% in 2025.
- Organizations with fully integrated AI personalization report average revenue lifts of 34% year over year.
- Enterprises spending over $500,000 annually on AI personalization platforms see a median ROI of 7.2x within 18 months.
- Brands using AI-driven funnel personalization now average 6.8% conversion rates, with top performers exceeding 14.3%.
- Adaptive content systems produce conversion lifts of up to 23% compared to static page experiences.
- User-generated content on SaaS product pages can increase conversions by as much as 154%.
- Chatbots embedded in the funnel improve conversion rates by roughly 27% on average.
Consistent, cited product positioning across these AI-personalized touchpoints is exactly what AI SEO work is designed to reinforce.
Page Speed and UX Impact on Conversion
Technical performance and user experience (UX) shape conversion rates just as much as messaging or offer strength does.
- A one-second delay in page load time reduces conversions by roughly 7%.
- 53% of mobile visitors abandon a page that takes longer than 3 seconds to load.
- Pages with an Interaction to Next Paint score under 200 milliseconds convert at 3.8x the rate of pages exceeding 500 milliseconds.
- Every additional 100 milliseconds of delay reduces conversion probability by 7.1%.
- Brands achieving sub-1-second load times through edge delivery report an average 31.4% revenue lift per session.
- Mobile traffic accounts for 79% to 82.9% of landing page visits, though desktop still converts roughly 8% more efficiently.
Bottom Line
Sales funnel statistics keep confirming the same fix works better than adding more traffic. The median B2B funnel converts at just 2.9% overall, but top-quartile teams hit 39% at a single stage like lead-to-MQL. The ceiling is a lot higher than most teams assume.
Optimization consistently beats acquisition on pure returns. Structured CRO programs deliver 223% ROI, yet companies still spend $92 acquiring traffic for every $1 spent converting it. This imbalance is the clearest opportunity sitting in most B2B funnels right now.
AI personalization is closing part of that gap, lifting average conversion rates to 6.8% and pushing top performers past 14%. The funnels improving fastest in 2026 fix their weakest stage first. Then they layer AI and speed improvements on top of a foundation that already converts.
Sources
CausalFunnel – Accessed July 2026
Glue Up – Accessed July 2026
Delverise – Accessed July 2026
SyncGTM – Accessed July 2026
Prospeo – Accessed July 2026
SHNO – Accessed July 2026
Personizely – Accessed July 2026
Amra and Elma – Accessed July 2026
Amra and Elma – Accessed July 2026
DesignRush – Accessed July 2026
SQ Magazine – Accessed July 2026
The Frank Agency – Accessed July 2026
Scoop Market – Accessed July 2026

Usama runs a boutique, revenue-focused SEO and AI search consultancy for B2B brands. He works with a capped number of clients each month, embedded as a senior fractional strategist. The goal is always the same: make organic a sustainable pipeline channel. When he’s not building search strategies, he’s probably watching cricket or learning more about coffee.
Follow for B2B marketing contentReady to turn AI search into a pipeline channel?
Tell me what you’re working on. In 30 minutes we’ll dig into your goals, where the gaps are, and what it actually takes to win on Google and AI search.


Trusted by B2B companies and SEO agencies on 4 continents
Learn more from my resources.

7 Best Fractional SEO Services for B2B SaaS in 2026
11 min read
10 best LLM SEO agencies for SaaS in 2026
14 min read
How to rank in ChatGPT search results: VISIBLE framework explained for B2B SaaS
14 min read

9 Best LLM SEO consultants in 2026: pricing, model, and who they fit
15 min read
10 Best Siege Media alternatives for B2B SEO in 2026
12 min read

10 Best B2B SaaS SEO Agencies and Consultants for Pipeline Growth in 2026
16 min read